
Professor of Ecology
Department of Biological Applications and Technology
University of Ioannina
Ioannina 45110, Greece
+30-26510-07337
info@john-halley.com
Quick Links
My recent research
I like research. Here is some of what I have been investing my time in over the last couple of years. All groundbreaking stuff.
- Extinction and biodiversity loss
- 1/f-noise
- Spatial ecology
- Sacred natural sites
- Hyper-exponential growth
Extinction and Biodiversity Loss
Habitat loss is considered to be the most important cause of extinction today. However, when habitat is lost, the species do not all go extinct immediately. There is a relaxation process during which the system sheds the unsustainable biodiversity. This unsustainable part is known as the extinction debt. An important question remains: at what rate does extinction debt kick in? It has been estimated that 10,000 species per year are “committed to extinction” due to habitat loss. But this prediction has been questioned by some who say that since we don’t observe these extinctions, they are not in fact occurring and will not occur?
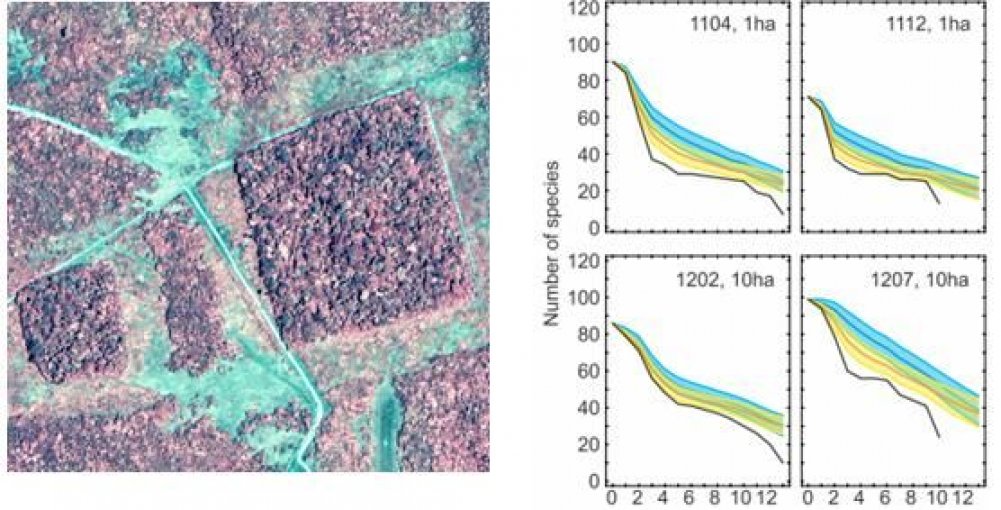
Left. Forest fragments left after habitat clearance in the Amazon. Such fragments provide important information about the response of species richness to habitat loss. Right. Numbers of bird species (vertical axis) observed in four forest fragments as a function of time (horizontal axis) up to 12 years after isolation (from G. Ferraz et al. 2003 “Rates of species loss from Amazonian forest fragments” PNAS vol. 100, p.1406).
My research on extinction debt is concerned with finding that size of this lag, what it depends on and in constructing a model of this process. So far, with colleagues we have found the rates for various taxonomic groups and fitting our data to the neutral model has had some success.

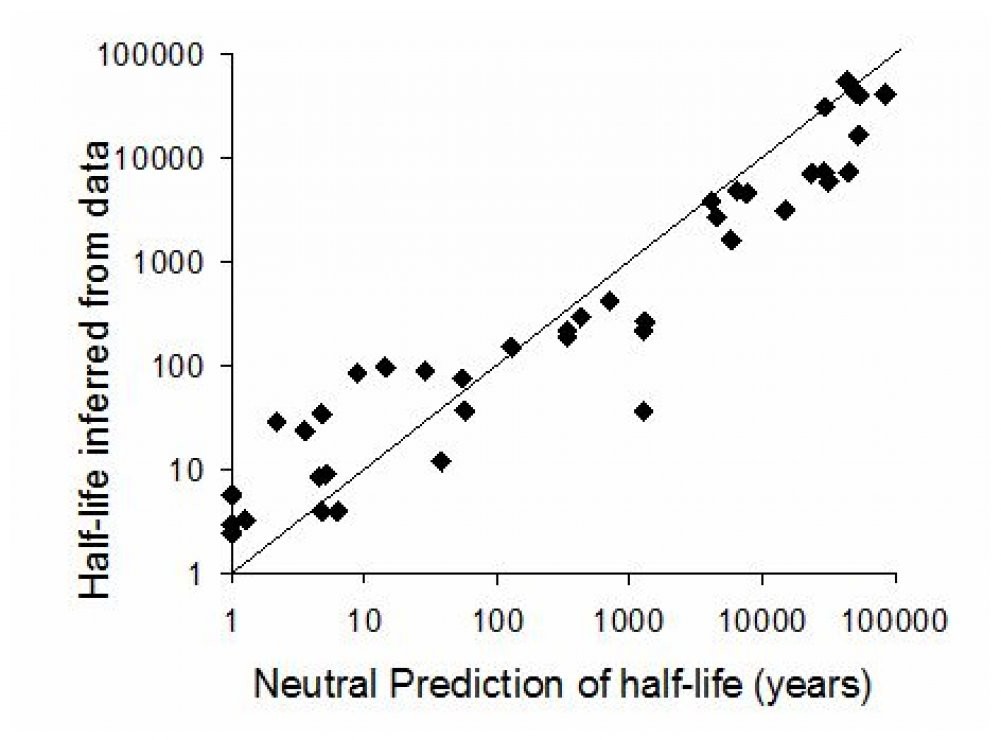
Left. Schematic of the biodiversity loss, showing the role of delayed extinctions. Right. Larger islands take longer to pay off their extinction debts, results from Halley & Iwasa (2011).
Bibliography
Veresoglou, S.D., Halley, J.M. & Rillig, M.C., 2015. Extinction risk of soil biota. Nature communications, 6.
Halley JM, Iwasa Y, Vokou D. Extinction Debt and Windows of Conservation Opportunity in the Brazilian Amazon – Comment. Science. 2013; 339:271-c.
Halley JM, Sgardeli V, Monokrousos N. Species-Area Relationships and Extinction Forecasts. Annals of the New York Academy of Sciences. 2013; 1296:50-61.
1/f-noise
1. The logic of 1/f noise
2. The 1/f noise model of environmental variability
3. 1/f noise and community dynamics
1. The logic of 1/f noise
Suppose you are throwing coins, lots of them. Heads is worth 1 and tails is 0. Your turn is every minute and your score is the sum of all the individual coins. The first coin is repeated every turn, the second every two turns, the third every four. And so on, so the kth is repeated every 2k turns. Then, to a decent approximation, your score fluctuates as 1/f-noise.
The power-spectral density of 1/f noise is proportional to 1/frequency, hence the name. We look to the per-octave spectrum to see its grand statistical regularity: the per-octave spectrum is completely flat; there are equal contributions to variability from all timescales. Though your 1/f noise process ranges from one cycle per minute down to a cycle every 2k minutes or whatever, a true 1/f noise process spans the entire spectrum. However, no timescale is preferred, all have the same importance.
That is, 1/f-noise is completely scale invariant: processes on scales of 10-100 years contribute at much as processes of 1-10 years of 100-1000 years and so on. So as the duration of observation increases geometrically from years, to decades, to centuries and on to millennia, the corresponding variance rises linearly without limit.
1/f noise is prevalent everywhere. The search for a reason has been called “one of the grand challenges of science“ and has led to a great struggle to find the origin of this phenomenon. My own research is not concerned with origins but with consequences. Namely the effect of 1/f noise on ecological population size and on ecological communities.
Halley J. Ecology, evolution and 1/f-noise. Trends in Ecology and Evolution. 1996;11(1):33–37.
2. The 1/f noise model of environmental variability
It appears almost everywhere, in electronic devices, fatigue in materials, the traffic on roads, music, the distribution of stars and DNA sequences. So too in Ecology.
Ecological populations are “ever-changing”, but according to what laws? One of the most important patterns, discovered by Pimm and Redfearn, is that ecological populations do not converge to a “balance of nature” but fluctuate, apparently without limit. We confirmed this and in addition showed the connection with 1/f noise. The variance of ecological populations tends to increase in logarithmic fashion:
V(Dt) ~ ln(Dt)
This form of ever-growing variance is the signature of 1/f-noise. Of course, this rule is a loose one, like most rules in ecology. Clearly though, if we lack a priori knowledge, 1/f-noise is the best assumption, if we have no knowledge of the population.
The techniques developed for ecological populations can also be applied to environmental variability such as climatic change. I used a model of 1/fa-noise to describe the variation of the earth’s temperature and hence to solve the attribution problem. I showed that based on patterns of past variability, it is very unlikely that the current rising temperature is a natural phenomenon.
Bibliography
Halley J, Kunin V. Extinction risk and the 1/f family of noise models. THEORETICAL POPULATION BIOLOGY. 1999;56(3):215–230.
Halley JM. Using models with long-term persistence to interpret the rapid increase of Earth’s temperature. PHYSICA A. 2009;388(12):2492–2502
3. 1/f noise and community dynamics
The notion of ecological 1/f noise arises naturally from the Hypercube concept of the ecological niche. Each axis of the hypercube represents a resource but each resource axis has only two settings (hot-cold, dry-wet, … etc). Each axis fluctuates at its own timescale 2k. So, for K resources there are 2K niches each of which can be occupied by a species. This creates a dynamic community in which the fortunes of each species follow the fluctuation of the axes.
Each niche is described by an xyz coordinate 0 or 1. The blue divider lines fluctuate to describe environmental variation. Clearly at this snapshot the niche at 000 is at a maximum and that at 111 is at a minimum.
This creates a community in which the fluctuations of species populations are 1/f noise, the species-abundance distribution is a lognormal. This model can be used to investigate community dynamics from a niche-based perspective, thus making it different and complementary to Hubbell’s neutral model, which ignores niches entirely.
Spatial Ecology
1. Fractal boundary models
2. Fractal population estimation
3. Climatic shifts
Spatial models are playing an increasing part in ecological modelling and data analysis. Our analysis of spatial systems investigates ecological boundaries, climate shifts through fractal models and Monte-Carlo statistical methods. One of the important problems that I have been looking at is how the spatial scale affects the way in which space matters. This is closely connected with fractals, because fractals are simply objects in which scale does not matter. So fractals are a kind of null model for species distributions. For example, how species richness seems to change according to the scale at which you observe it (below)
1. Fractal boundary models
Changing patterns of species richness of woody plants on Mt. Holomondas, Halkidiki, Greece for two scales 2m×2m (left) and 14m×14m (right). Darker colours denote higher species richness. Note the point (shown by arrows) which changes from a low-richness area at high resolution to a hotspot at coarser resolution.
2. Fractal population estimation
Modeling spatial distribution and abundance of species
Spatial distribution and abundance of species of species have been of great interest for ecologists and understanding such patterns is key to a species’ conservation efforts. A species’ spatial distribution and abundance are linked. The Abundant Centre Hypothesis states that a species is more abundant at the centre of its distribution and as we move along an environmental gradient towards the edges, it becomes scarcer, since the optimal conditions for its survival are not met. While this have been a popular hypothesis amongst researchers, it’s been difficult to prove because various factors deemed responsible for the observed species distributions are acting on different spatial resolutions.
Left: An instance of a fractal species’ distribution along an altitudinal gradient of a mountainous region. Interference generated by factors operating at various spatial resolutions is “masking” the abundant centre. Right: Campanula lingulata widespread biennial species of the Campanulaceae family, with a range of 700-2000 m of altitude that can be found in mount Olympus.
We collected spatial data along an altitudinal gradient for a biennial species (Campanula lingulata) from the mountainous region of Olympus and are developing a fractal spatial distribution model in order to investigate the validity of the Abundant Centre Hypothesis, and eventually, help clarify the underlying relationship of species’ distributions with the effect of the environmental factors that shape them.
3. Climatic shifts
Many changes observed in distributions in N. hemisphere. Over the last ten years climate has been warming on average at a rate of 0.0307 degrees per year. In 10 years by about 0.31 degrees. For a fixed latitude we expect, on average, sites to move 45m upwards over 10 years. For a fixed altitude, sites should move 43 km northwards over 10 years.
We have been using the Community Temperature Index (CTI) to study butterfly community of Dadia Forest over 13 years: between 1998 and 2011. CTI is the average temperature (long-term) experienced by all species over all its range. We have shown through the CTI, that the butterfly community has arrived at a higher CTI, showing changes in community composition.
Bibliography
ZAKKAK, S., PANAGIOTOPOULOU, M. and HALLEY, J.M., 2013. Estimating the abundance of shearwaters and gulls in the north aegean sea. Marine Ornithology, 41, pp.141-148.
Sgardeli, V., Zografou, K. and Halley, J.M., 2016. Climate Change versus Ecological Drift: assessing 13 years of turnover in a butterfly community. Basic and Applied Ecology.
Sacred Natural Sites
In the mountains of Northwest Greece, an important and characteristic feature of the cultural landscape are the sacred natural sites consisting of isolated veteran trees or sacred forests around chapels. Their foundation and maintenance is often interpreted as the management of natural resources and ecosystems through religious rules, while their conservation is ensured by taboos and potential supernatural punishments to trespassers. These sacred forests are little known outside the communities that have preserved them, communities that today are suffering from abandonment. The taboos also are fading with the older generation and the knowledge about them is getting lost.
Over the last five years, the University of Ioannina has hosted an interdisciplinary project entitled “Conservation through Religion: the Sacred Groves of Epirus” (“SAGE” 2012-2015, scientific coordinator John M. Halley), aiming at the study of the biodiversity and cultural value of these sacred forests and their effective conservation. Detailed work in the area among other things led to a proposal to the Greek Ministry of Culture, Education and Religious Affairs, as the Sacred Forests of the area to be included in the National Inventory of Intangible Cultural Heritage list (UNESCO, Greece). The successful proposal (approved 17/7/2015) is dedicated to the memory of our colleague professor Oliver Rackham.
Moreover, as part of the feedback to the local communities with which we worked, we created an environmental education package entitled: «Ancient trees, their values and importance for biodiversity conservation» (Kalliopi Stara and Despoina Vokou (editors). This was based on the results of SAGE project and paid special attention to local culture and history, as well as the appreciation of trees as habitats for many other organisms and as long living creatures with aesthetic, spiritual and historic value that can inspire people towards Nature conservation.
The THALIS-SAGE programme led to various initiatives and results:
it has drawn attention both to the conservation value of sacred natural sites in Epirus and their current need for conservation today.
assembled a huge biodiversity dataset for 8 different groves and associated control areas with 5000 records of nearly 821 different species.
provided a boost to the ethnographic and historical studies in Epirus.
published the book The ancient trees, their values and their importance for biodiversity conservation and the associated environmental education course by K. Stara and D. Vokou (editors) with contributions from various participants of the programme.
Analysis of the large biodiversity dataset is ongoing. A major question that we continue to pursue is how effective SNS can be in preserving biodiversity, given than most are very small.
Hyper-exponential Growth
This is a new area of research. This was prompted by reviewing the book “The bet” by Paul Sabin that features the wager between economist Julian Simon and the ecologist Paul Ehrlich, a wager that was lost resoundingly by the environmentalists.
Simon claimed that whatever environmental strain was imposed by an increasing human population would be more than offset by improved technologies. His challenge (aided by the earlier work of Boserup and Kuznets) should be taken more seriously. It is not enough to disbelieve him and simply repeat Malthus’ basic argument. More sophisticated arguments and models are needed, especially concerning the ecological dynamics of mutualistic systems. When can hyper-exponential growth happen and for how long? What are the limits to such growth? What would a collapse, if it comes, look like?
Hyper-exponential growth is not common in nature but there are some exceptions, most shorter-lived than exponential growth. These include
- Certain kinds of symbiosis
- The early stages of a mature cancer
- Human population
J.M. Halley, Preaching for the planet or just spinning our wheels, 2016. Conservation Biology, (In press)
Veresoglou, S. D., and J.M. Halley. “A model that explains diversity patterns of arbuscular mycorrhizas.” Ecol. Mod. 231 (2012): 146-152.
Halley, J.M. and Trangas, T., The rise and fall of the telomerase clone (In prep.)